Murrey Math Lines 15.03.2018 (USDCHF, GOLD)
USDCHF, “US Dollar vs Swiss Franc”
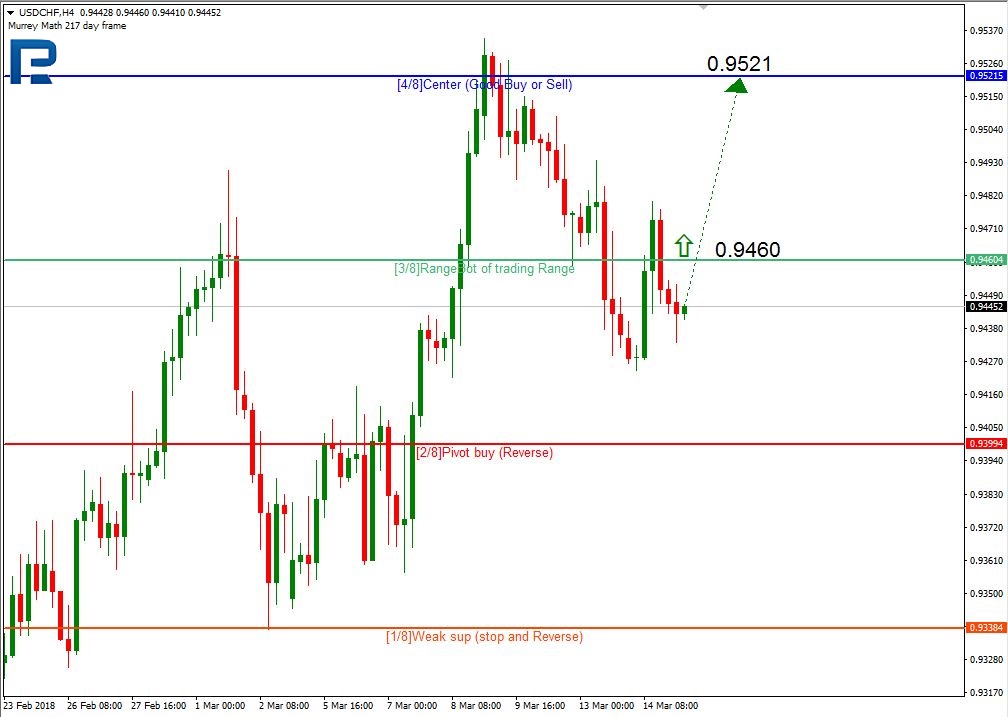
In the H4 chart, USDCHF may break the 3/8 level and then resume growing towards the resistance at the 4/8 one.

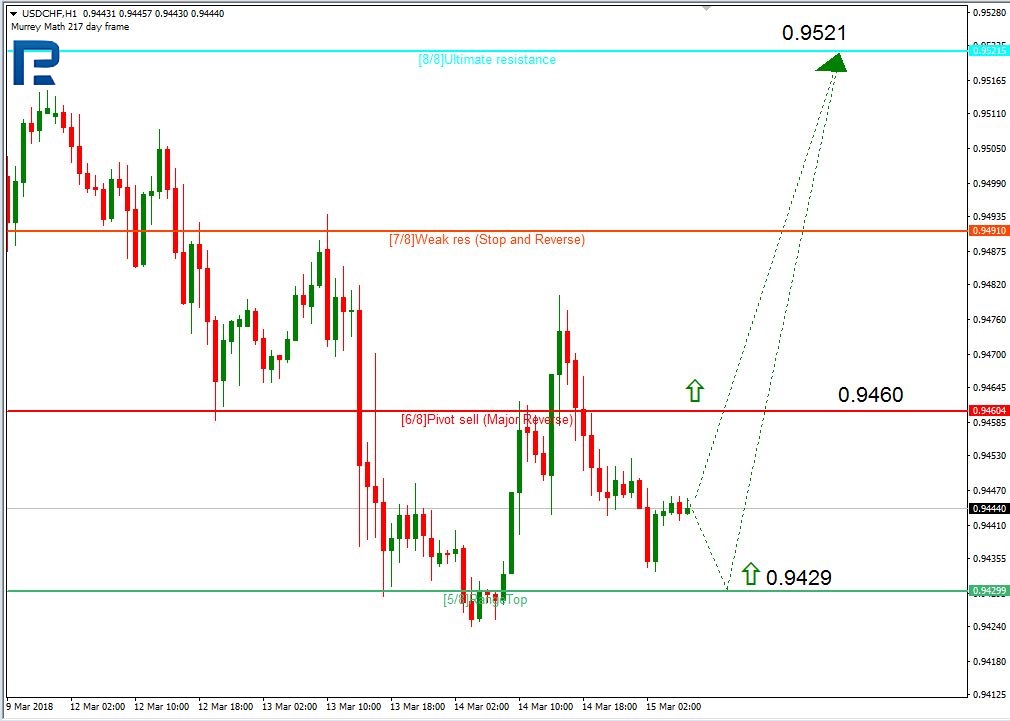
In the H1 chart, the pair may break the 6/8 level and then grow towards the resistance at the 8/8 one. However, the price may yet test the 5/8 level, rebound from it, and only then resume growing towards the 8/8 one.
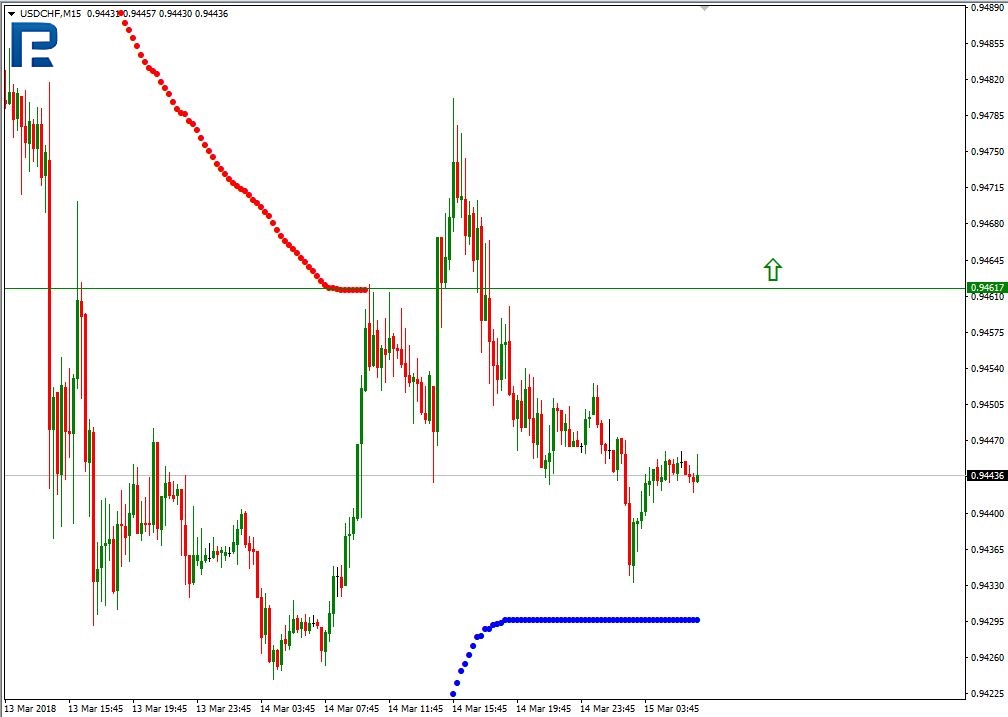
As we can see in the M15 chart, the pair may break the upside line of the VoltyChannel indicator and, as a result, continue moving upwards.
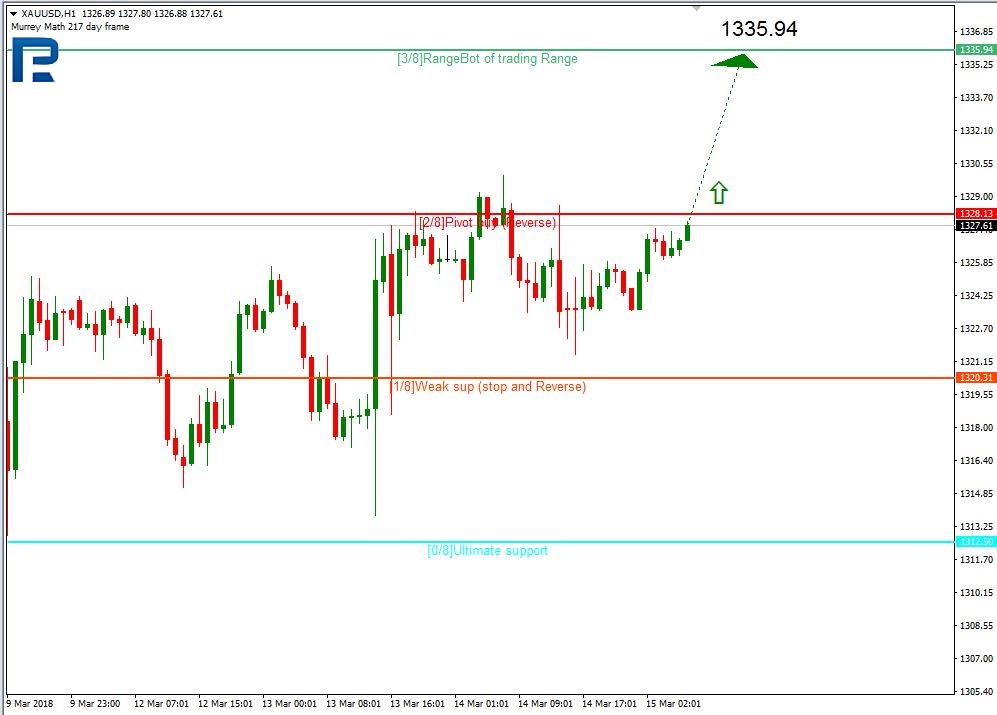
XAUUSD, “Gold vs US Dollar”
In the H4 chart, XAUUSD is expected to break the 2/8 level and continue growing towards the resistance at the 3/8 one.
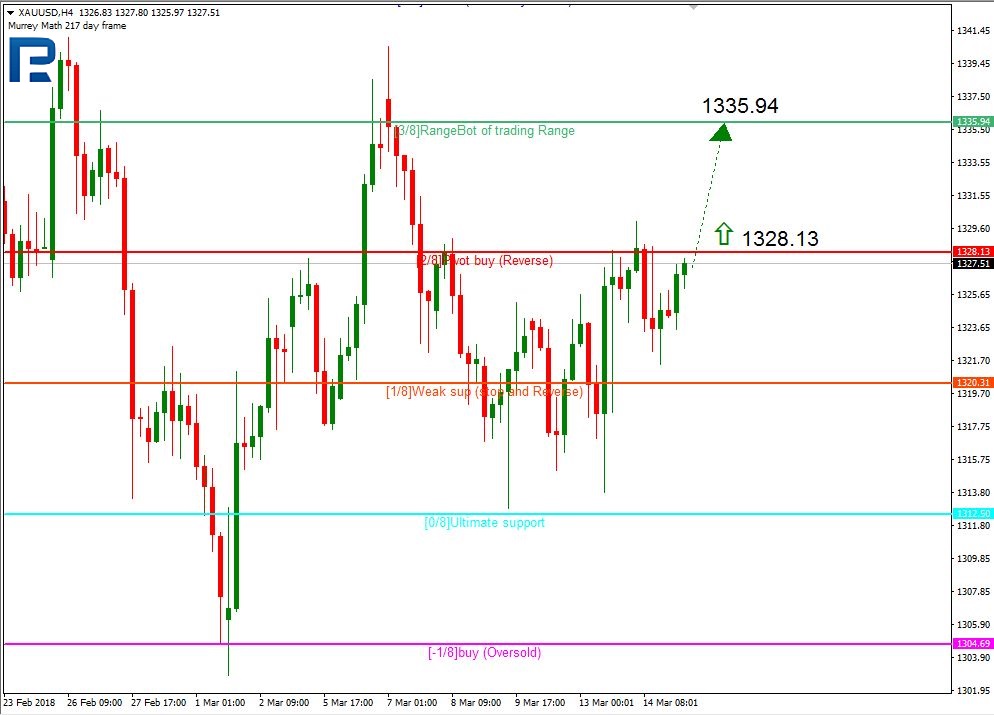
The lines in the H4 and H1 charts are completely the same and confirm the scenario described above.
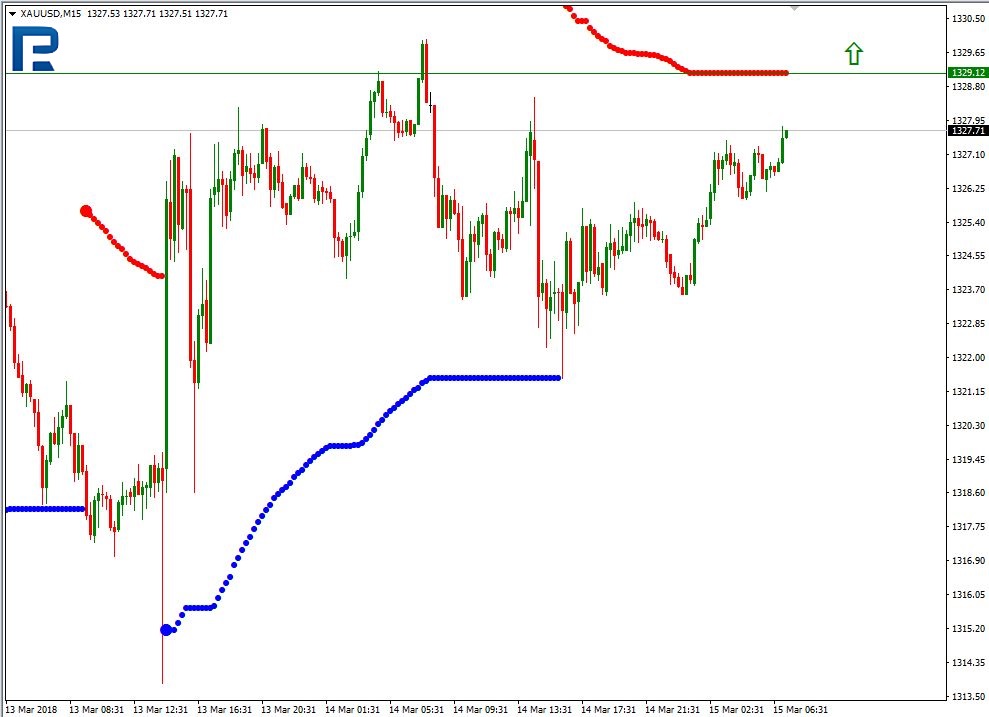
As we can see in the M15 chart, the pair may break the upside line of the VoltyChannel indicator and, as a result, continue moving upwards.
RoboForex Analytical Department
Forecasts presented in this section only reflect the author’s private opinion and should not be considered as guidance for trading. RoboMarkets bears no responsibility for trading results based on trading opinions described in these analytical reviews.
The material presented and the information contained herein is intended for our customers, and is for information purposes only and in no way should be considered as the provision of investment advice for the purposes of Investment Firms Law L. 87(I)/2017 of the Republic of Cyprus or any other form of personal advice or recommendation, which relates to certain types of transactions with certain types of financial instruments.