What is Russell 2000 and How Does It Differ from S&P 500?

6 minutes for reading
This overview is devoted to the popular stock index, Russell 2000: its contents, how it differs from the S&P 500, and ways of trading it.
What is Russell 2000?
The Russell 2000 index (US Small Cap 2000) is one of the leading global indices, which is based on the stock prices of 2,000 small capitalisation companies traded in the US. The index was created in 1984 by the Frank Russell Company, which is part of the London Stock Exchange. Russell 2000 is called a wide market index among small companies, as it represents the stock price dynamics of tier 2 and 3 companies.
The Russell family consists of several indices, the most famous of them being:
- Russell 3000 – an index based on the stock prices of the 3,000 largest public companies registered in the US. Their overall capitalisation constitutes 97% of the American stock market
- Russell 2000 – this index consists of the 2,000 smallest companies in the larger Russell 3000 index
- Russell 1000 – this index tracks 1,000 stocks from Russell 3000 with the highest rating
Russell 2000 is the most popular index among the investors who hold shares of companies with small capitalisation. Investors usually track this index to assess the market efficiency of small enterprises mostly working for the domestic market. An investor's portfolio automatically diversifies as long as the index includes many companies.
Leading companies of Russell 2000 include startups in the spheres of healthcare, food, and consumer goods. Russell 2000 is calculated based on the capitalisation-weighted stock price of all the companies in it. The index is revised yearly, with some companies being removed from it and others being added.
How does Russell 2000 differ from S&P 500?
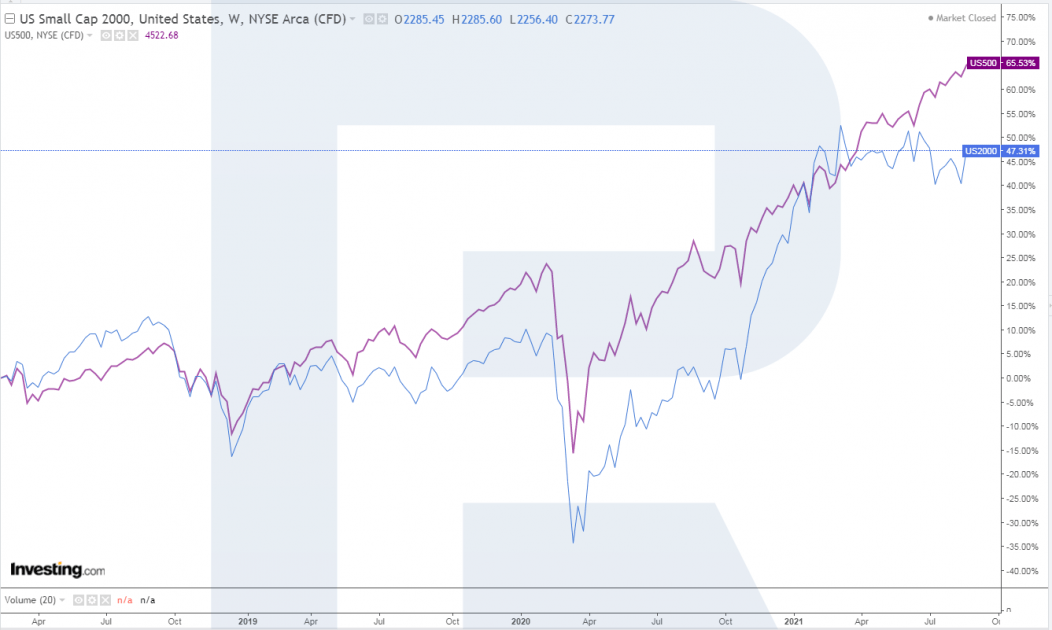
These two indices have common features but also differences. S&P 500 is a wide market index that includes companies with the highest capitalisation, while Russell 2000 is a wide market index with low capitalisation. The main differences are as follows:
- The number of companies: S&P 500 features the shares of the 500 largest companies, while Russell 2000 measures the share value of the 2000 smaller ones
- Capitalisation of companies: S&P 500 tracks the leading companies; it is meant for investors who hold the shares of large enterprises Russell 2000 demonstrates the state of affairs in small companies; it is meant for investors who hold small but promising shares in their portfolios
- Volatility: depending on the current market conditions, the volatility of S&P 500 and Russell 2000 may differ. At certain times, one index demonstrates better volatility, while the other comes to the scene as soon as the situation changes
On the whole, regardless of all the differences, S&P 500 and Russell 2000 have been showing similar dynamics.
How to trade Russell 2000
First of all, Russell 2000 is an investment instrument, but it can also be used for short-term trading. A variety of different strategies may be used for trading Russell 2000, thanks to a wide range of instruments (ETFs, futures, options, CFDs).
Investing
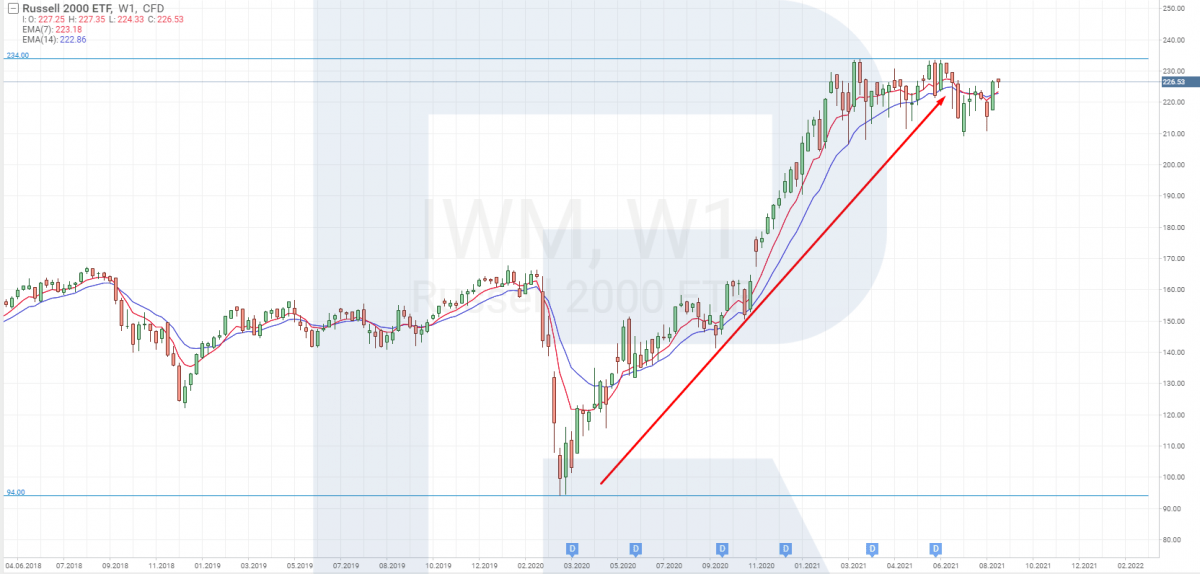
This index, as well as others, can be used for long-term and medium-term investments. It's rather difficult to gather such a vast portfolio (of 2,000 stocks) on your own. Hence, one of the investment instruments here is ETF. And one of the well-known ETFs on Russell 2000 is iShares Russell 2000 ETF (IWM).
Example:
During the 2020 crisis, iShares Russell 2000 ETF (IWM) dropped to $94. You could buy this ETF after it has stopped falling and has started recovering. Its growth eventually exceeded 100%, reaching $234.
Trading by tech analysis
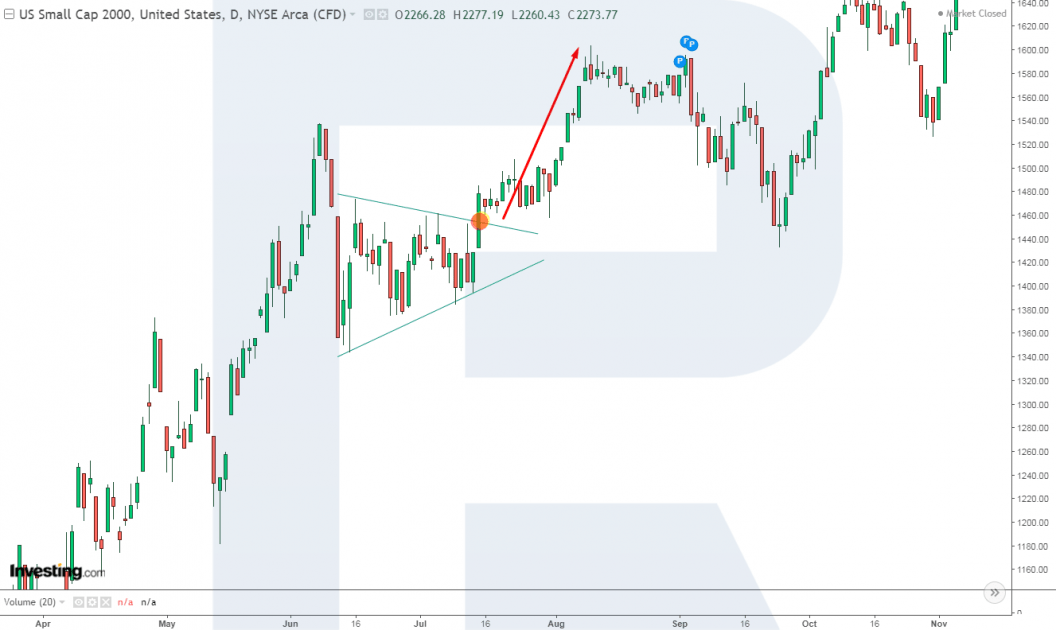
Trading by tech analysis implies a detailed analysis of the Russell 2000 chart. Use classic tech analysis instruments: trendlines, support and resistance levels, price patterns, candlestick patterns, Price Action - and various original methods: Elder Three Screens, Wolfe Waves, Joe Ross Hooks, and other popular strategies of market gurus.
Example:
- When the index was growing in July 2020, the price formed a Triangle on the chart;
- When the price line broke through the pattern upwards, you could open a buying position, counting on further growth of the quotes.
Trading by indicators
Various indicators can be used for trading Russell 2000: from just a single indicator to a whole trading system. Depending on your timeframe and strategy, you can make both short-term and long-term trades.
Example:
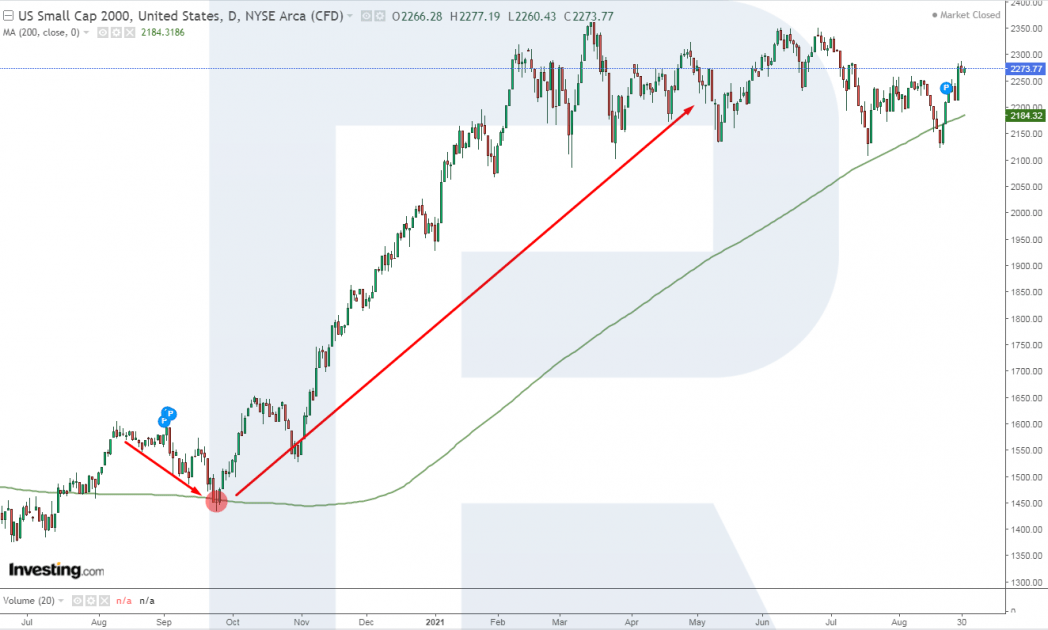
- Let's take trading with the Moving Average (200): if the price secures above the indicator, it signals to buy; if it secures below - it signals to sell.
- On D1 of Russell 2000 for August 2020, the quotes secured above the SMA (200) line. Then it corrected to the indicator line and bounced off it upwards.
- Right after the bounce forms, you could open a buying position, counting on further growth of the index.
Closing thoughts
The Russell 2000 index is calculated by using the weighted market capitalisation of the stock price of 2,000 small companies that are trading in the US. This is one of the leading global indices that indicates the situation of a wide range of companies with small capitalisation. Investing is a popular strategy for trading this index, which is also suitable for short-term trading.
* - Past performance does not predict future returns.
Disclaimer: The material presented and the information contained herein is intended for our customers, and is for information purposes only and in no way should be considered as the provision of investment advice for the purposes of Investment Firms Law 87(I)/2017 of the Republic of Cyprus or any other form of personal advice or recommendation, which relates to certain types of transactions with certain types of financial instruments.





 are complex instruments and come with a high
  of losing
  rapidly due to
  . 65.68% of retail investor accounts lose
  when trading
  with this provider. You should consider whether you understand how CFDs work and whether you can afford to take the high